Living in a time where we are so surrounded by technology, we would think that it makes sense that companies would start to take online information and use it to their advantage. Businesses around the world are using customer analytics to drive up profits and keep customers happy.
But what is customer analytics?
Customer analytics is the process by which data from customer behavior are used to make business decisions. In more simple terms, it’s businesses tracking your every move online, compiling profiles on each customer so they can improve the shopping experience. The information they take ranges from four main categories. These include personal, quantitative, qualitative and descriptive data. Now that we have the basics, read on to find out more about the top 5 Customer Analytics You Should Be Measuring to increase your businesses profits and better adapt to customers.
For a better customer conversation management data analytics, use conversational technology. Request a demo now!
See also: Prioritize Customer Conversations
Best Customer Analytics to Boost Business
1. Demographics
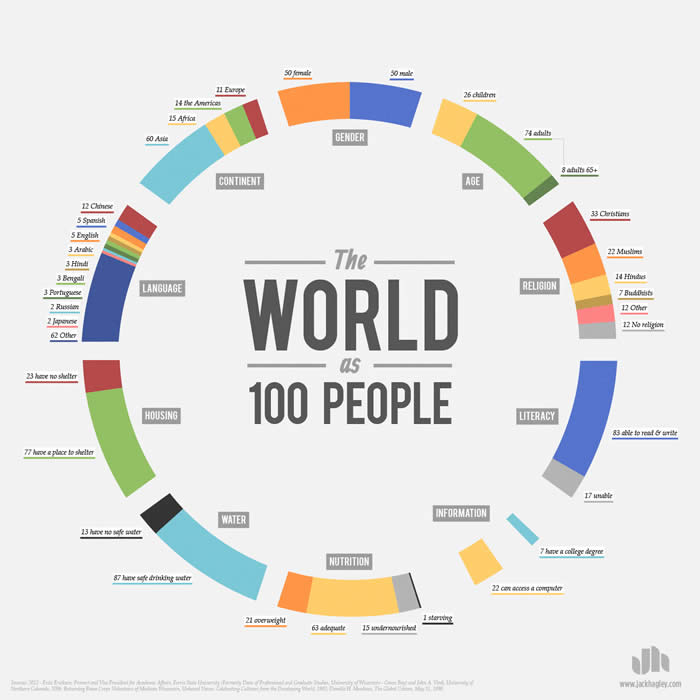
Demographics are the basics of customer analytics. It is essentially a personal profile on each one of your customers. These consist of categories such as age, gender, race, geography and income. This information is important to marketers especially. For example, if a company is trying to target teens and young adults through their marketing campaign, they would be able to see if their advertisements are getting to the correct people. If they see that for some reason only people 40+ are visiting their site, it is easy to conclude that they need to find a new way to reach their intended customers. Demographics, although seemingly basic, are one of the most important customer analytics to track.
2. Sources of Incoming Traffic
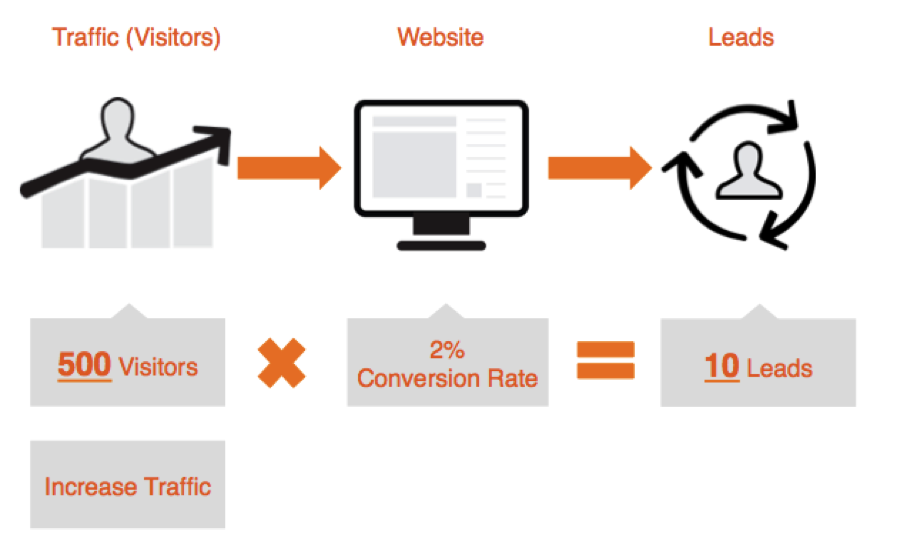
Being able to track where your customers came from is also an extremely important factor when it comes to customer analytics. If your company has been trying to market on different platforms such as email, Twitter, Facebook, Instagram or Snapchat, you can see what campaigns are working. This is essentially the same as the demographics analytic except the difference is in the application they are coming from and not personal qualities.
3. Returning Customer Conversion
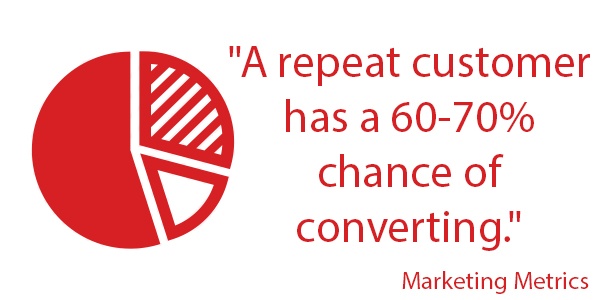
Gaining new customers is 6.5 times more expensive for a company than keeping an existing customer, so why not prioritize your existing customers? This is why using the metric of returning customers can save companies vast amounts of money. If a customer has already been on your site, you can once again track the way they got to the page. Noticing that most of your returning customers are coming from social media, you could possible scale back outside marketing or TV ads. This would most likely cut costs and allow you to focus more on keeping your old customers as well as increasing advertising in places that tend to have returning customers.
4. Page Views
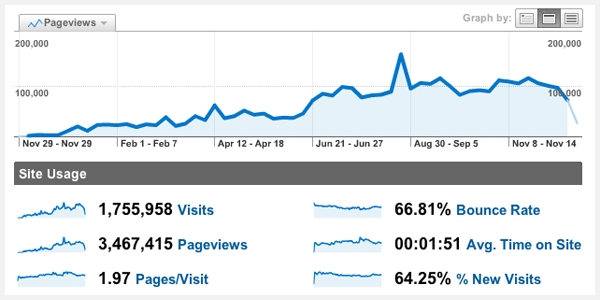
Page views, one of the more simple topics in analytics, are simply the number of visitors your website or individual page gets. It is important to get the most page views you can to bring in as many customers as you can. This function can also monitor specific blogs or PDFs that your company posts. This will allow your company to post more blogs or PDF that are on similar topics. It is important to know what part of your website interests your users the most so you can develop more of that material.
5. Average Session Duration
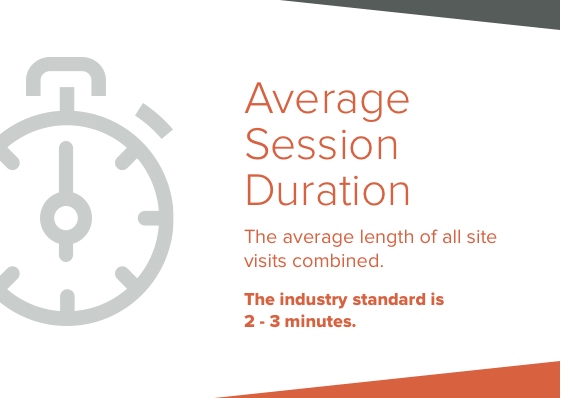
When it comes to making big business decisions, such as spending large sums of money on advertising, a company will want to know who to target and why. All of this information can be found using Google analytics. It is important to know who spends more time on your website so you can gear your advertising toward them. For example, the average Facebook link stays open for only 10 seconds where average direct URL is open for closer to 53 seconds. The people who spend more time are obviously more interested in your product, but you also have to look at where the traffic is coming from to understand the true data. You can even see what pages on your website are visited the most. For example, say that a company has a blog page that attracts more views than any other page. You can have your employees focus on outputting more blogs on topics that have been getting the most clicks and highest average session duration.
Analysis of The Analytics

As you can see, all of these chosen analytics work together, but a company has to find the patterns and solutions to the problems they are seeing. While it may seem that monitoring just demographics or page views will not boost a business too much, the long tail effect comes into play by monitoring more and more analytics. As the world keeps embracing the technological changes in our society, more businesses will move to using customer analytics to improve business strategy and efficiency. Google analytics makes tracking your customers habits and desires that much easier too. These analytics are the best option for a company to get a well-rounded look at who, what, and where website traffic is coming from. They lay the platform for more analytics to be built on.
